


The focus of Performance testing is checking a software program’s mainly focus on it’s Speed, Scalability and Stability. The features & functionality supported by software is not only the concerns for the performance testing. The goal of performance testing is not only the finding bugs in the code but also the find out the bottlenecks & eliminate them.
In terms of software testing process, performance testing is a general testing process works on the particular work loaded application, web application or system to determine how the application performs in terms of particular workload and how much the application is stable in work load situation. Performance testing also does examination, measurement, validation or verification to test scalability, reliability and resource usage of the application, web application or system. It can be used to analyse complete server performance under heavy load.

Using JMeter, Performance testing process provides following benefits to the system or application,
- JMeter is useful to test the performance of static resources such as JavaScript and HTML, and dynamic resources, such as JSP, Servlets, and AJAX.
- JMeter is useful to determine maximum number of simultaneous users that users website will be able to handle.
- JMeter is useful to provide a various graphical analyses of performance reports.
JMeter Performance Testing contains:
- Load Testing: Load testing is a part of performance testing to know the performance of the system under the load condition. Load testing can be performed when concurrent number of users performs of specific application at particular time period. Using JMeter, Load Testing models the estimated usage by simulating multiple user get the web services simultaneously.
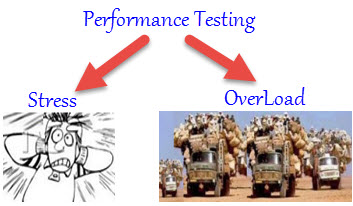
- Stress Testing: Stress testing is important to recognize the upper limits of capacity within the system. Usually we go this testing to recognize the system’s robustness in terms of excess load and assists application administrators to judge if the system will perform satisfactorily if the current load goes well above the ordinary maximum.
Any application or web server has a maximum load capacity, when server gets overloaded beyond its load capacity, it will start responding slowly and produce errors. In JMeter, Stress Testing is useful to determine the maximum load the web server can handle.
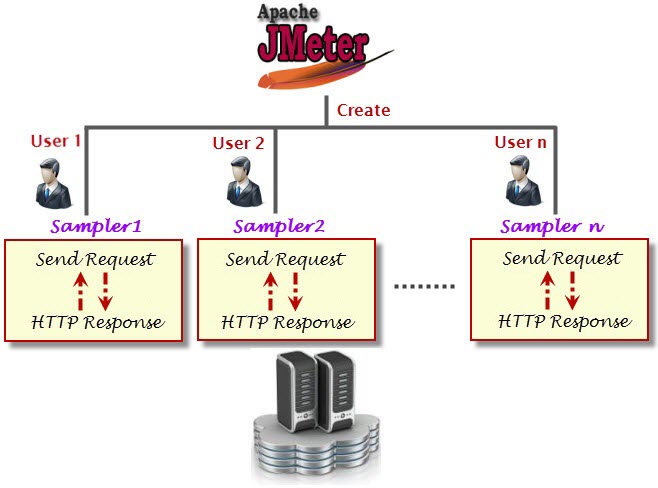
Following image will help you to understand how JMeter replicate heavy load conditions:
Steps to build-up a Performance Test Plan in JMeter
Here we will check the performance of Google.com accessed by 1000 users
Before doing performance testing on web application, first to determine – Normal Load, Heavy Load and the target.
Normal Load determines that how many average number of users visit to the website.
Heavy Load determines that how many maximum numbers of users visit your website and the target in this test.
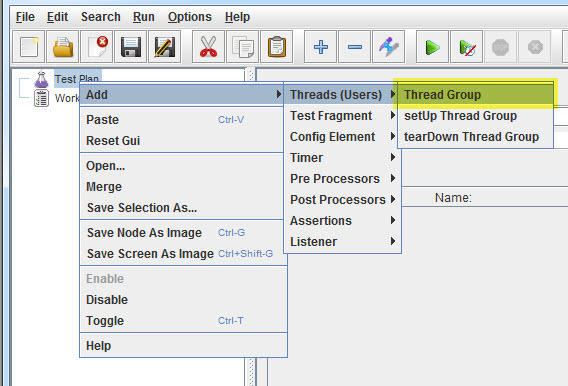
Step 1: Create the Thread Group
To create the Thread Group, first run JMeter, from opened interface of JMeter choose Test Planfrom the tree and right click to choose Add àThreads (Users)à Thread Group.
After opening thread Group, enter Thread Properties as shown in figure below,
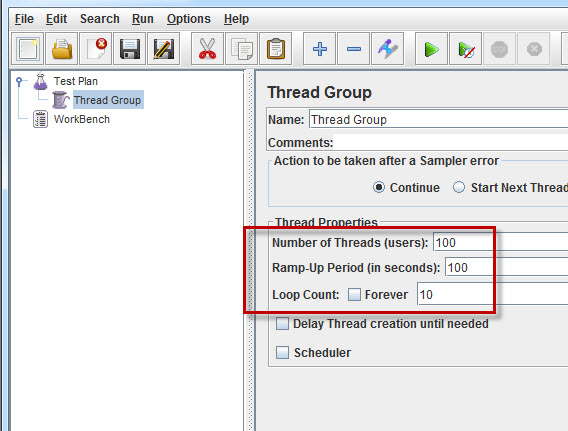
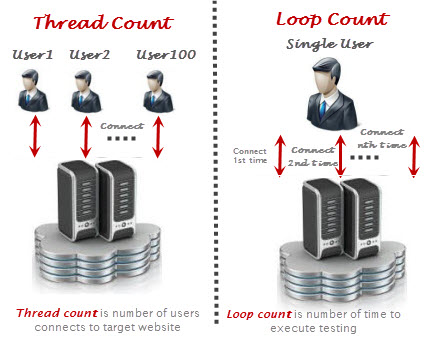
In the above figure, Number of Threads: 100 numbers of users are connected to target website, Loop Count: execute testing 10 numbers of times, and Ramp-Up Period: 100.
The Thread Count and The Loop Counts both are different. In the Thread Count, it simulates 100 simultaneous users trying to connect the targeted website. In the Loop Counts, it simulates 1 user trying to connect the targeted website 10 times.
Step 2: Add JMeter elements
In this article we will Add,
-
HTTP request Default element.
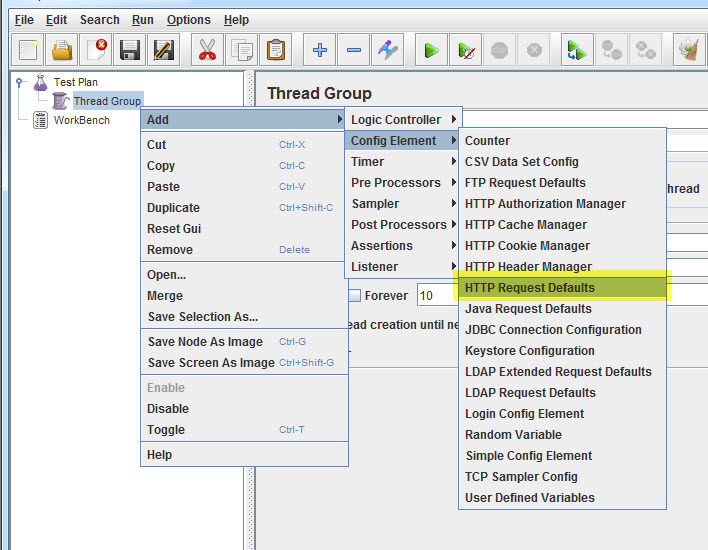
To get this element, go to Thread Group and right-clicking, from context menu select
Add -> Config Element -> HTTP Request Defaults.
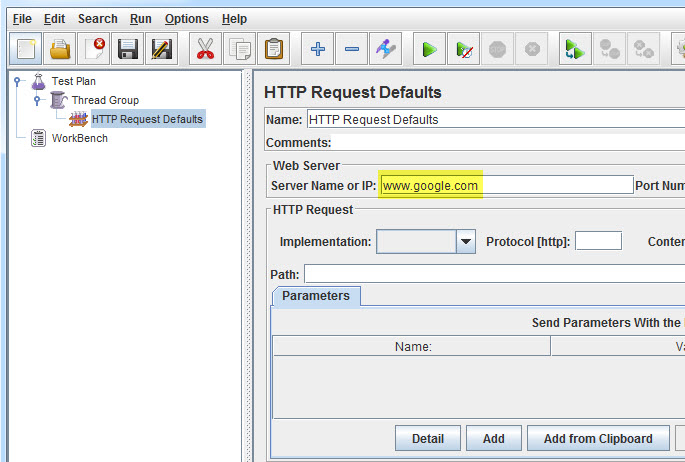
In the HTTP Request Defaults page, enter the Website name(www.google.com) under Web server à Server name or IP.
-
HTTP Request
To get this element, go to Thread Group and right-clicking, from context menu select
Add -> Sampler -> HTTP Request.
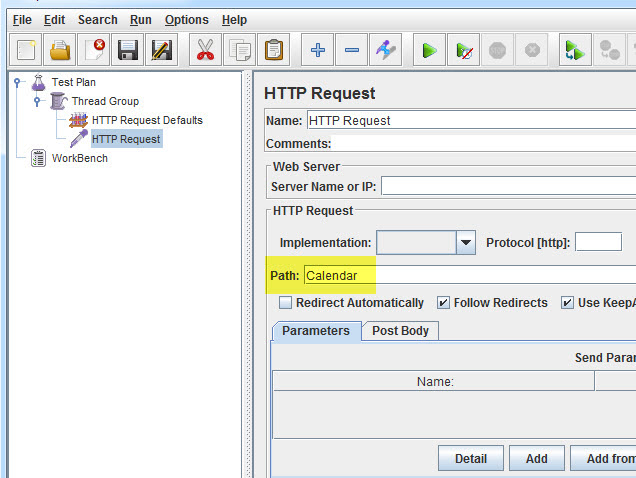
“Path” field in HTTP Request pages how’s that which URL request you need to direct to Google server like: enter “calendar” text in Path field. JMeter will generate the URL request http://www.google.com/calendar to Google server. If you leave the Path field blank, will URL request will be http://www.google.com.
Step 3: JMeter Test Result in Graphical Format
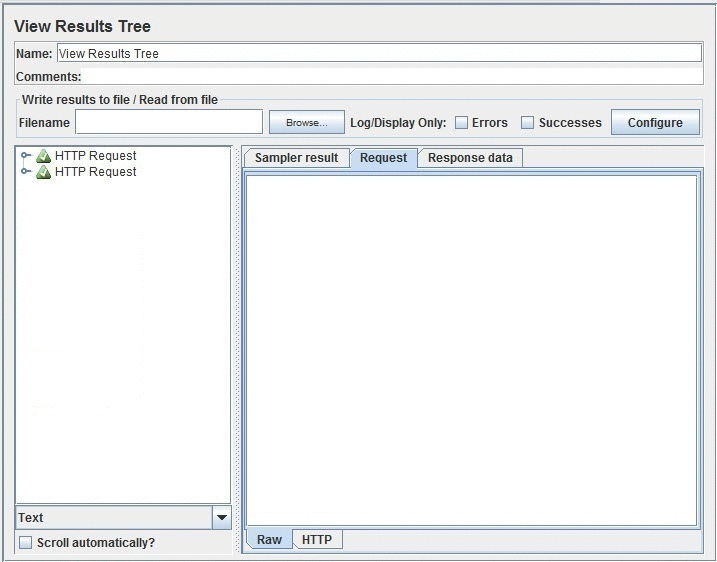
A) View Results Tree:
View Result Tree is an most commonly used listener to get the full detail along with response time, and response code. Most of the performance tester is use this listener while doing performance testing.
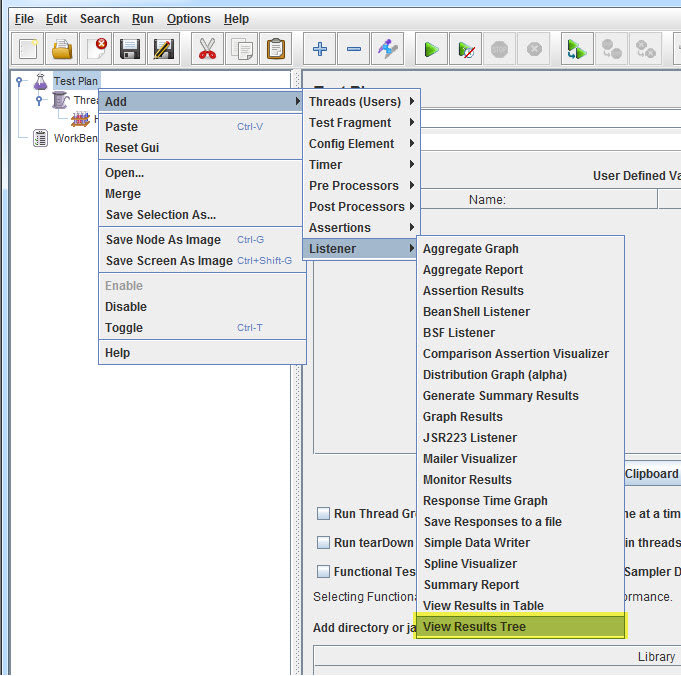
To add View Results Tree listener, right click on Test Plan and click on
Add -> Listener -> View Results Tree.
B) Graph Results:
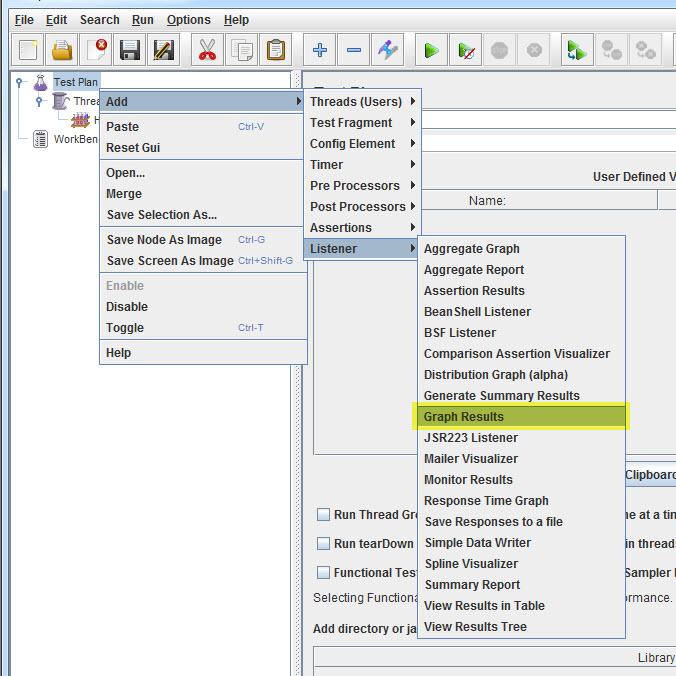
JMeter test result can also be shown in Graphical format. To do that, right click on Test Plan and click on
Add -> Listener -> Graph Results.
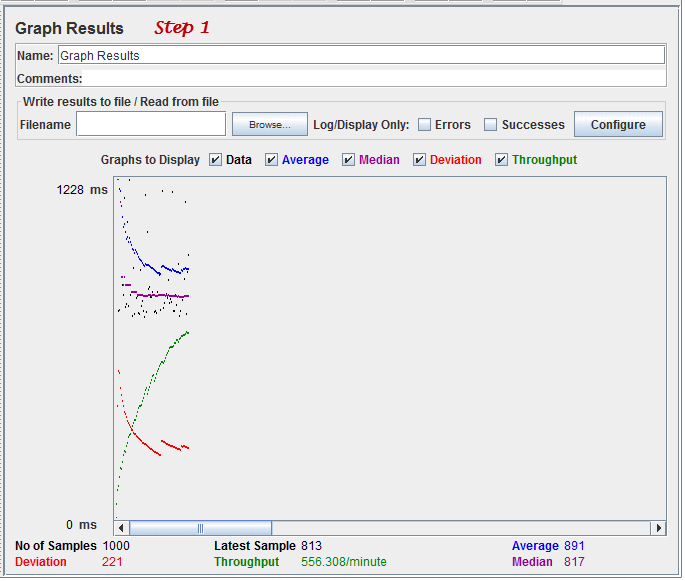
Step 4: Get the test result in Graph
In JMeter interface, click on Run button or press Ctrl + R on Toolbar to execute the test. It will display the real time test result in Graph.
The figure shows the View result tree & graph of a test plan, where 100 users are simulated and access the website www.google.com.
View Result Tree
Graph Results
If you like this article, consider subscribing to get all Testing Updates in your Inbox for FREE. To get testing tips Click Here.
Don’t Miss Another JMeter Article
Join over 10,000 people who get FREE and fresh content from this Blog.
We Respect Privacy, You’re Safe! No Spam!