This is the 5th tutorial in our UFT training series. You can checkout FREE UFT/QTP Training page where you can get all UFT articles listed in one place. In this training series we are covering almost all parts of UFT/QTP in detailed with simple examples for better understandings. In last post we have learn about UTF 12.0 First Look After Installation which help you to quick kickoff your UFT/QTP Training series. In today’s article let’s have a look on different Overview of UFT Panes.
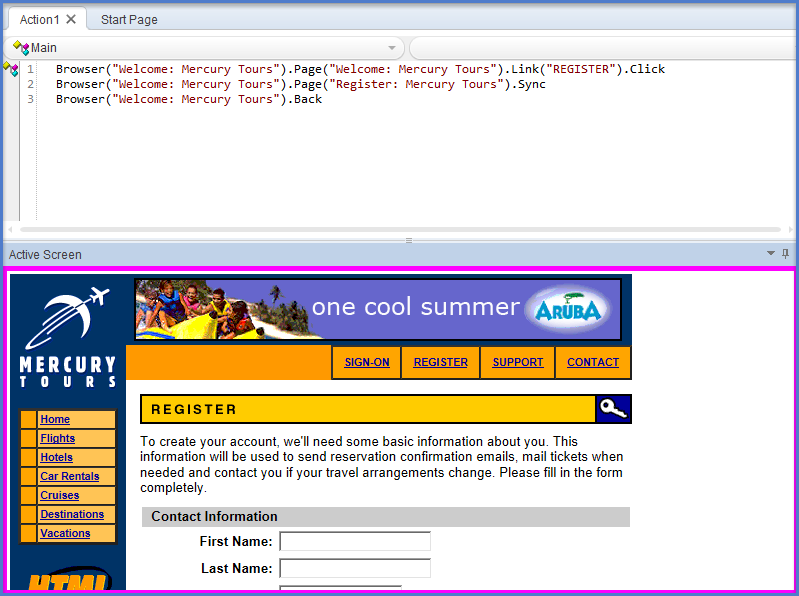
Active Screen Pane:
The Active Screen offers a snapshot of that particular application under test on which some action has been performed during the recording session. Also, the Active Screen page contains detailed property information about each object as like the original page displays.
To vision the Active Screen, select View > Active Screen.
Bookmarks Pane:
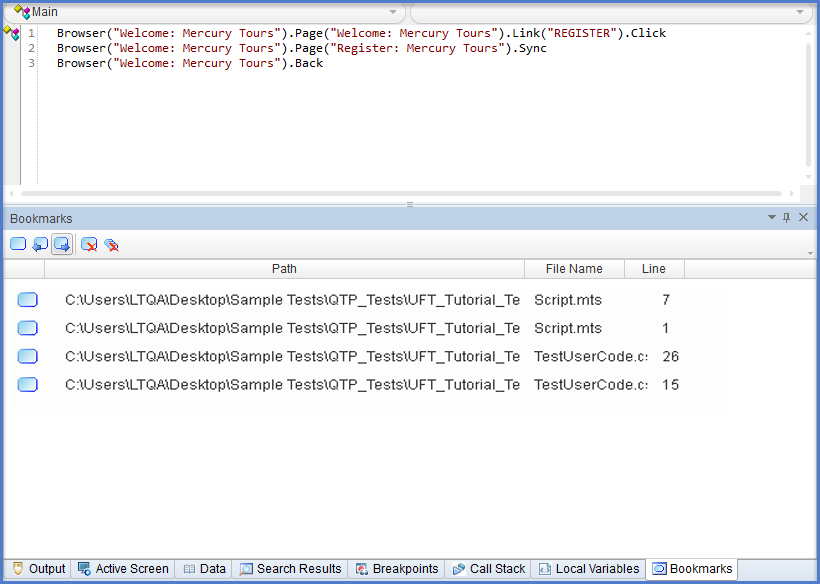
The Bookmarks pane shows all bookmarks kept during test, it can be components, function libraries, user code files, etc. The pane allows users to generate bookmarks, see the detail about injected bookmarks, and traverse to the document comprising the bookmark.
To vision the Bookmarks pane, select View > Bookmarks.
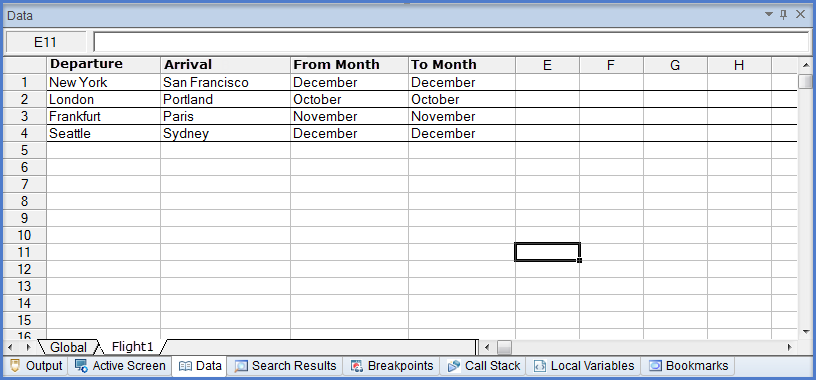
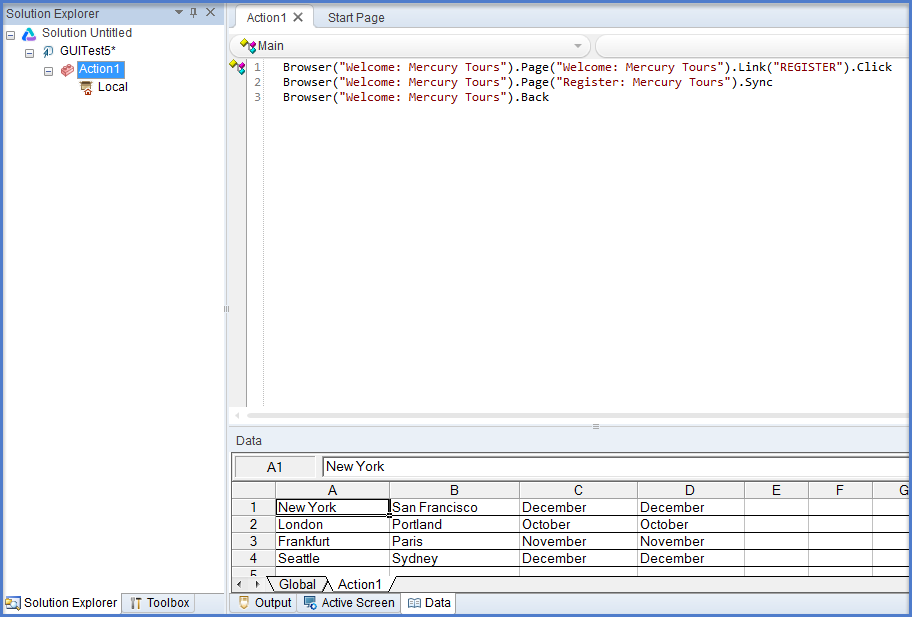
Data Pane:
The Data pane shows the data related to the test or component, or business process testing flow. It displays the data in spreadsheet table with numbers of columns and rows which will be helpful in parameterizing that data.
To display the Data pane, select View > Data.
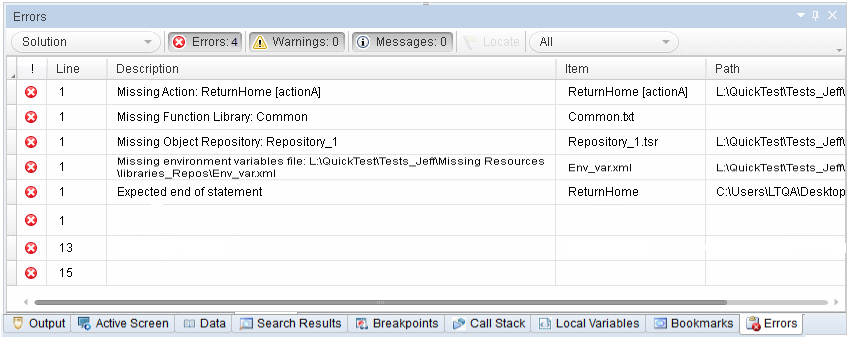
Errors Pane:
The Errors pane displays errors comes because of test like; missing resources and coding syntax errors. Detected errors automatically display in the Errors pane, if it is not opened too. To know the source of the error, just double-click on the error to see the particular error belongs to which data, component, or path.
Missing resources are the resources that are available in the test or component but during run time of the application or function, application does not get the exact sources. Information errors offer a list of coding syntax errors in the test or function library scripts.
To view the Errors pane, select View > Errors.
Debug Pane:
The Debug pane provides various options that are given below,call users to debug their document or code file,
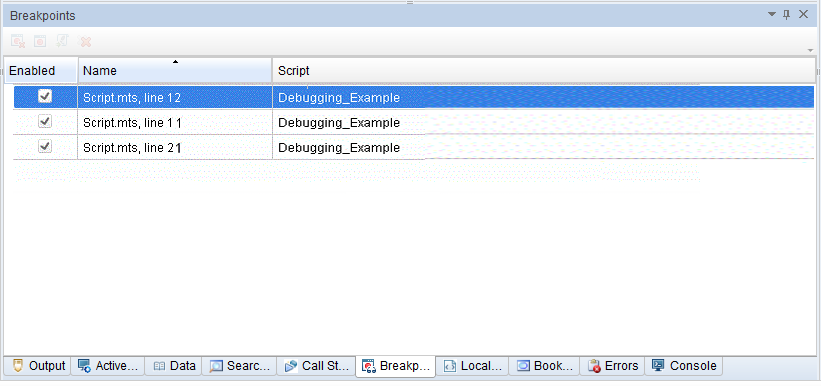
Breakpoints: Shows the breakpoints detail available into tests, function libraries, or user code files and permits user to enable or disable the breakpoints.
Call Stack: Shows the detail information about the function and method calls presently running in a test, function library, or user code file.
Loaded Modules: Available for API testing only,shows detail information about the .dll files related with the present run session.
Threads: Available for API testing only,shows detail information about all the threads running in the existing context of the test.
Local Variables: Shows the present value and type of all variables that were documented up-to the last step done throughout the run session that user is debugging. User can also change the value of the variable, manually.
Console: Facilitates user to run lines of script to set or change the present value of a variable, code object, property, method, or function call in the test or function library.
Watch: Shows the present value and type of any variable or expression that user added to the Watch pane.
To see the Debug pane options, go to View > Debug and select the required debug pane.
Window Layout:
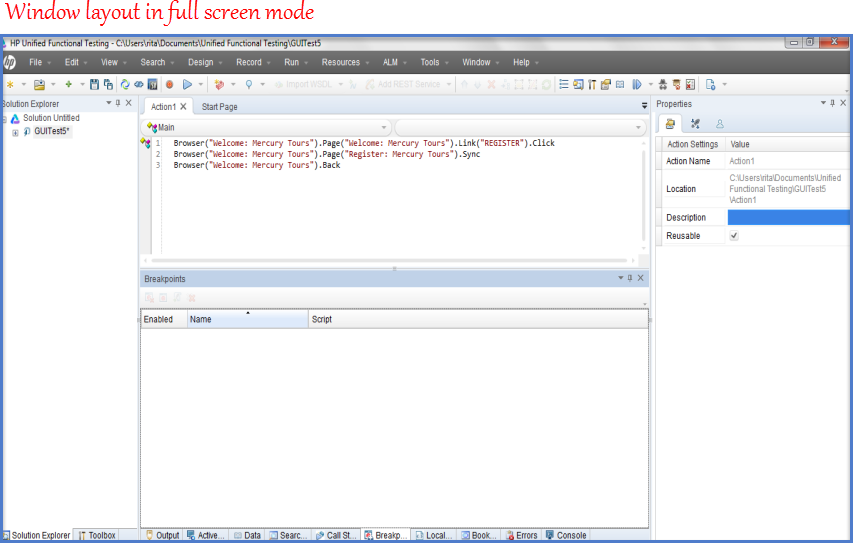
Window layout facilitates user to change the layout of the UFT window like;user can move and resize panes, select to show or auto-hide panes, create tabbed panes, and select which toolbar to display. User can also re-establish the default layout. User can customize the UFT window as per the requirement of each type of UFT session like; view/edit, record, and run sessions.For example; full screen the UFT to create or edit the test, component, or application area, and minimize the UFT window to run the test.
With the customization of UFT window layout, all document types and session types also get changed.
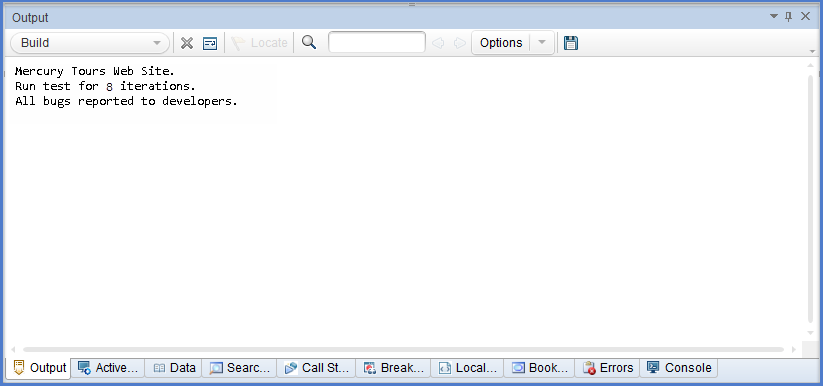
Output Pane:
In case of GUI testing,Output pane allows user to see information sent during run time by the Print Utility statement.
In case of API testing, Output pane allows user to see the Output log for the compilation and test run.
To view this pane, go to View > Output.
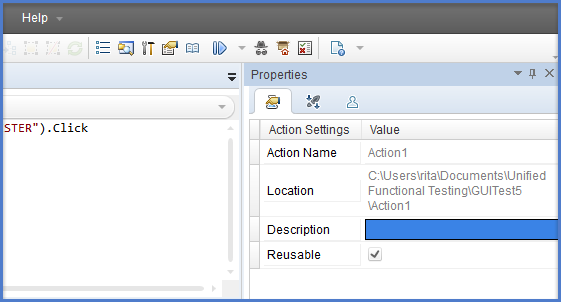
Properties Pane:
The Properties pane displays properties of a test, action, component, function library, or application area and facilitates user to change the properties and parameters too. The information that displays in this pane is totally depends on the active document.
To view this pane, choose View > Properties.
Solution Explorer Pane:
The Solution Explorer Pane shows all resources involve with a test’s component, object, and functions, facilitates user to open all resources in this pane to add, remove, and manage all of the resources involved in particular test. Moreover, the Solution Explorer pane allows users to join multiple types of tests, components, application areas, function libraries, and user code files into a single solution.
User can open the resources and references involved in a test from the Solution Explorer pane by double-clicking on the name of the resource or reference.
To see this pane, go to View > Solution Explorer.
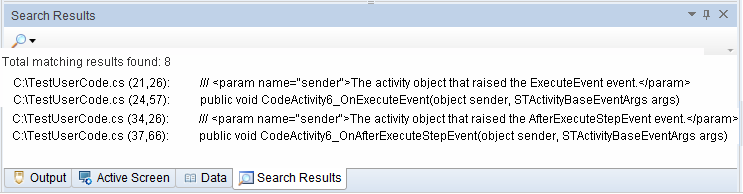
Search Results Pane:
The Search Results pane shows the result, performed by search options from Search menu, facilitates user to browse the results of the search, locate a specific result, and perform recent searches in order to receive updated results.
To see this Results pane, go to View > Search Results.
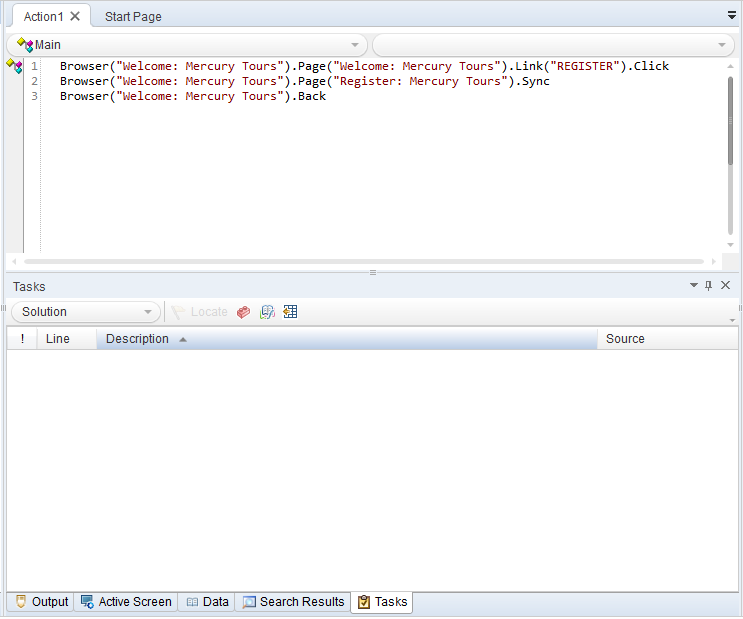
Tasks Pane
Using this pane, user can create, view, and manage the TODO tasks. A TODO task can be anything that should be completed during a test or component, such as giving information applicable for handing over a testing document, or adding a reminder to you to add steps that test a new page in an application. TODO tasks can be saved with the test or component. It also facilitates to see the TODO comments that be in an action, an open function library, or an open user code file.
To show or hide the Tasks pane, select View > Tasks.
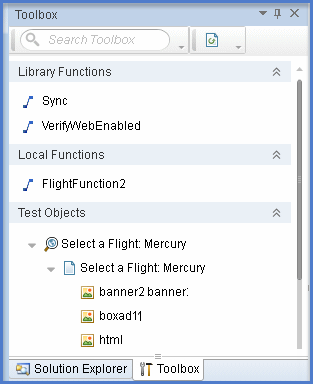
Toolbox Pane:
In case of GUI testing, the Toolbox pane contains all the keywords and functions of a test or component, facilitates user to drag and drop objects or calls to functions into a test or component. While dragging and dropping an object into a test or component, UFT adds a step with the default operation for that object.
In case of API testing, the Toolbox pane contains all the activities and flow control activities useful to generate an API test, facilitates users to drag and drop activities from the Toolbox pane into the canvas to generate a test, or double-click activities to generate a test flow.
In case of BPT, this pane shows all of the components and flows existed to the business process test or flow.
In today’s article we have learnt about brief introduction of all types of Panes present in UFT/QTP. In next UFT training tutorial we going to see different type of testing supported by Unified Functional Testing (UFT) 12.0.
⇓ Subscribe Us ⇓
If you are not regular reader of this website then highly recommends you to Sign up for our free email newsletter!! Sign up just providing your email address below:
Happy Testing!!!


1 thought on “Overview of UFT Panes – UFT/QTP Training Tutorial 5”
Good content.Easy for beginners.