In today’s world, we evaluate the efficiency of the testing team through a number of defects unveiled versus the test cases or scenario was written. Similarly, there should be an approach through which we can calculate the complexity of code written by the development team that could be correlated to the number of coding errors. As a result, Cyclomatic complexity term comes into picture which is the measurement of a source code complexity. It is calculated through a control flow graph which is developed on the basis of source code which measures the number of linearly-independent paths through a program module. In this article, we will understand the concept and the formula to calculate Cyclomatic complexity with an example.
The target here is to have Cyclomatic complexity as low as possible for the best source code. If it is low then the risk to modify code is lower and the code will be easier to understand and maintain. Given below is the formula through which Cyclomatic complexity is evaluated.
<td”>
Cyclomatic Complexity
| Cyclomatic complexity = E – N + 2*P
where, E = represents a number of edges in the control flow graph. N = represents a number of nodes in the control flow graph. P = represents a number of nodes that have exit points in the control flow graph. |
Example
Let’s understand Cyclomatic complexity with the help of the below example. Here is the source code to display the values of different variables based on the comparison. I have taken 4 variables with different values.
Source Code Written in JAVA
package com.stc.cc;
/**
 *
 * @author Aparajita
 *
 */

public class CyclomaticComplexityDemo {

       public static void main(String[] args) {

             // TODO Auto-generated method stub

             int var1 = 10;
             int var2 = 9;
             int var3 = 8;
             int var4 = 7;

             if (var1 == 10){

                    if(var2 > var3){

                           var2 = var3;

                    }

                    else{

                           if (var3 > var4){

                                 var3 = var4;

                           }

                           else{

                                 var4 = var1;

                           }

                    }

             }

             else{

                    var1=var4;

             }

             System.out.println("Printing value for var1, var2, var3, and var4"+var1+" "+var2+" "+var3+" "+var4);

       }

}
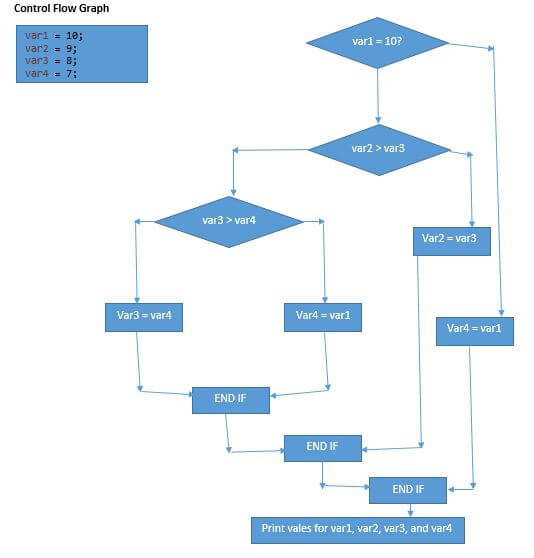
Below is the representation of control flow graph based on the demo source code we have written above. We will calculate the number of edges, nodes and the exit points to calculate Cyclomatic complexity using the formula. I have marked edge as “E” and nodes as “N” in the below diagram for better understanding.
Control Flow Graph:
Cyclomatic Complexity Calculation:
After noticing the above control flow graph, we can evaluate the following values of Cyclomatic complexity parameters.
- E = represents number of edges in the control flow graph = 11 edges
- N = represents number of nodes in the control flow graph = 11 nodes.
- P = represents number of nodes that have exit points in the control flow graph = 1 exit point
By using the formula, Cyclomatic complexity => E – N + 2*P
- 11 -11 + 2*1
- 2
Therefore, Cyclomatic complexity for the above control flow graph is 2 which is an acceptable number. In a similar way, using the same formula we can calculate the Cyclomatic complexity for any source code and based on the result, we can determine the risks and associated maintenance cost. It can be really useful for overall project budgeting.
QA perspective:
To understand the importance of Cyclomatic complexity from a QA perspective, the result we get from the formula determines how much testing is required to test that piece of source code. For example, if the number is higher, that piece of code requires in-depth testing compared to the code which has lower Cyclomatic complexity. Our testing scope and the methods would be defined according to the complexity of the functionality. The control flow graph for the code under test can be obtained from the developer to calculate the number of edges, nodes and exit points. Also, a number of test cases for maximum test coverage can be determined as well based on the paths in the CFG (control flow graph) and the branches. In other words, Cyclomatic complexity is very helpful for QA to estimate the scope of testing, determine how skilled tester is required, and the extent of testing required for the best way possible code coverage. Also, it is one of the best ways with which developers can make QA team to understand the source code complexity.
Conclusion:
Cyclomatic complexity calculation is one of the standard approaches to calculate the source code complexity and determine the risk that the source code possesses for any future modification and maintenance. Lower the Cyclomatic complexity better is the code quality in terms of complexity.
If you are not a regular reader of this website then highly recommends you Sign up for our free email newsletter!! Sign up just providing your email address below:
Happy Testing!!!

5 thoughts on “Cyclomatic Complexity with Example”
Hi,
I am not able to mlocate “E” or “N” in the given diagram as your have mentioned in the description Let me know what are all
Edges and Nodes in the diagram
Thanks
In the given diagram you have mentioned that Edges or Nodes are specified but i am not able to locate please clarify
Please reload the page if the page is not scrollable.
edge or node not mentioned in the givem diagram as specified i sent a feedback but no response great site
I is not scrolling issue please send me the diagram to my email id
sbalujob@yahoo.com