Within the endless number of performance testing options available today, WebLOAD is probably the industry’s best-kept secret. It is part of the earliest group of load testing tools that were launched in the 90’sand still provides a comprehensive and robust option if your goal is large-scale enterprise performance testing. WebLOAD includes extensive scripting capabilities, massive load generation (locally or on the cloud), analytics and reporting, and built-in integrations with APM solutions, functional testing tools, and open-source platforms.
Integrated Development Environment (IDE):
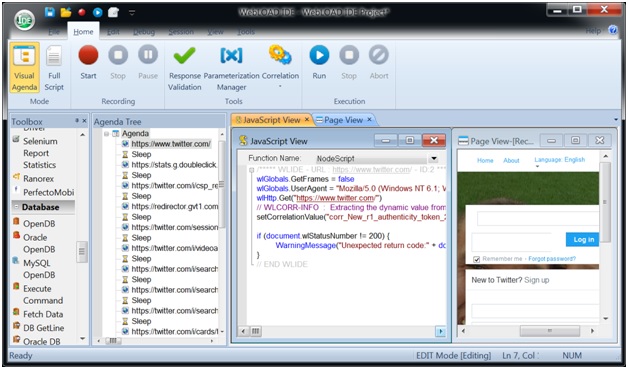
WebLOAD’s visual IDE offers a proxy-based recorder letting you record all web activity. Recording/playback can identify web page resources (CSS, js, images, etc.) and load them automatically. This is quite useful since often pages change between the time you record and playback your script, which in turn saves you the pain of editing the script to adjust for modified resources.
At the core of the IDE is the JavaScript View, the scripting language used to record tests. WebLOAD provides multiple ways to edit and enhance your script – starting of course, with direct editing (and debugging) of the script itself. Several other options for manipulating the script include HTTP configuration options (for browsers, caching, cookies, etc.), parameterization options (unique, random, global, sequential), and building blocks that can be dragged and dropped into the script (for example, an FTP call, DB connection, timers, etc.).
Automatic Correlation of Dynamic Values:
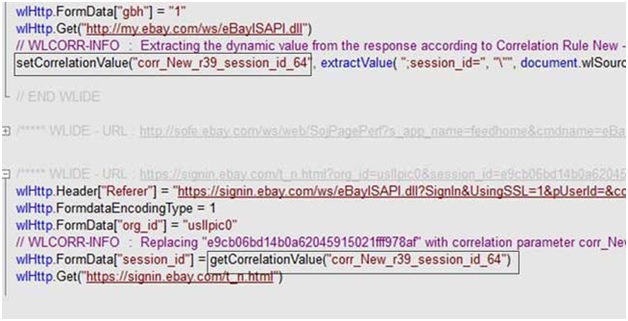
WebLOAD’s correlation identifies and replaces dynamic values that are unique in each test run, like session IDs and time, and replaces them automatically. The Achilles heel with automatic correlation is its accuracy, as well as the effort required to tweak and make edits.
The automated correlation process seems to be quite accurate with WebLOAD, in a sense that it correctly identifies many types of dynamic values within URLs, headers, and cookies. The code it generates is relatively concise so that it can be fine-tuned quite easily and does not require lengthy manual edits.
Enterprise Apps &Protocols:
WebLOAD has built-in support for many protocols and technologies like HTTP/S, HTML5, WebServices, Rest API, AJAX, push, FTP, SMTP, TCP, and others. The ability to work with Java objects provides the flexibility to address more unique testing requirements, such as homegrown applications.
Selenium Scripts:
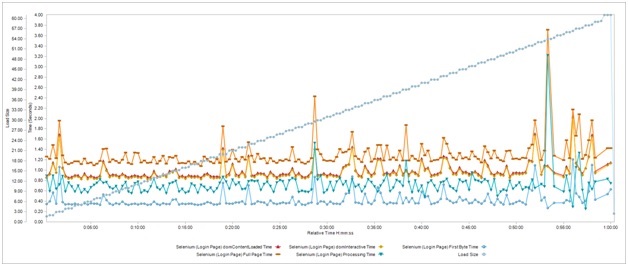
WebLOAD’s Selenium plug-in enables measuring real user experience as part of the performance test. By activating a real browser, you can measure its behavior and examine the real user experience while your system is under load.
You can record a script in Selenium and use WebLOAD’s plugin to export the script into WebLOAD, or you can code a Selenium script directly with the WebLOAD IDE. During execution, WebLOAD measures performance statistics that are collected by the browser, which enables viewing side by side the load size, Hits per Second of the test, and the real user experience on the same graph.
Load Generation:
To generate a virtual user load you can use both on-premise machines and the cloud. WebLOAD has a smooth integration with Amazon EC2, where it can automatically start and stop hosts using your Amazon credentials.
Managing scenario execution and virtual user distribution is done via the WebLOAD Console. You can define a variety of scripts, browsers, and network characteristics in a single test run. Using a scheduler, you can control the load build-up to mimic real-life conditions, using linear, steps, and increments of virtual users. A ‘throttle control’ feature lets you change the load size during execution using, stop for analysis, and restart.
Reporting and Analysis:
Following a load test session, WebLOAD Analytics generates a set of reports and indicates places with threshold violations. You can choose from over 80 different reports and graphs to analyze test results from different angles. Reports are customizable letting you identify specific areas and compare metrics across load sessions. You can choose from a variety of templates, apply filters, and control the layout.
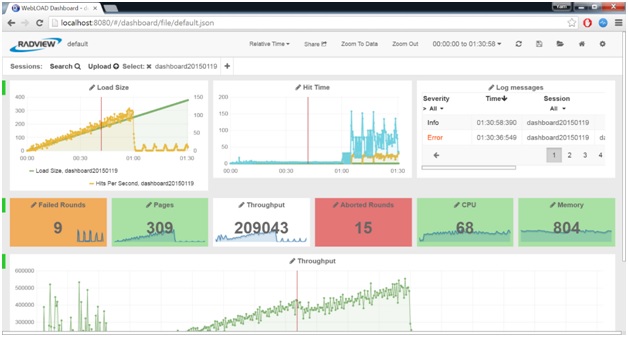
An additional analysis tool, the Web Dashboard, lets you view performance test results from any web browser or mobile device. This lets you share and communicate results such as Response/transaction time, throughput, and errors between multiple team members and report performance issues to management.
WebLOAD integrates with application performance management (APM) tools, which lets you drill down to specific events behind bottlenecks. Currently supports three of the large APM tools – Dynatrace, AppDynamics, and NewRelic.
Click here to read more about WebLOAD.
⇓ Subscribe Us ⇓
If you are not regular reader of this website then highly recommends you to Sign up for our free email newsletter!! Sign up just providing your email address below:
Happy Testing!!!