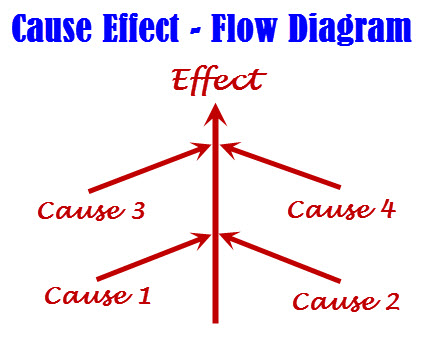
Cause-Effect Graph graphically shows the connection between a given outcome and all issues that manipulate the outcome. Cause Effect Graph is a black box testing technique. It is also known as Ishikawa diagram because of the way it looks, invented by Kaoru Ishikawa or fish bone diagram.
It is generally uses for hardware testing but now adapted to software testing, usually tests external behavior of a system. It is a testing technique that aids in choosing test cases that logically relate Causes (inputs) to Effects (outputs) to produce test cases.
A “Cause” stands for a separate input condition that fetches about an internal change in the system. An “Effect” represents an output condition, a system transformation or a state resulting from a combination of causes.
The Cause-Effect Diagram can be used under these Circumstances:
- To determine the current problem so that right decision can be taken very fast.
- To narrate the connections of the system with the factors affecting a particular process or effect.
- To recognize the probable root causes, the cause for a exact effect, problem, or outcome.
Benefits of making cause-Effect Diagram
- It finds out the areas where data is collected for additional study.
- It motivates team contribution and uses the team data of the process.
- Uses synchronize and easy to read format to diagram cause-and-effect relationships.
- Point out probable reasons of difference in a process.
- It enhances facts of the procedure by helping everyone to learn more about the factors at work and how they relate.
- It assists us to decide the root reasons of a problem or quality using a structured approach.
Steps to proceed on Cause-Effect Diagram:
Firstly: Recognize and describe the input conditions (causes) and actions (effect)
Secondly: Build up a cause-effect graph
Third: Convert cause-effect graph into a decision table
Fourth: Convert decision table rules to test cases. Each column of the decision table represents a test case
Symbols used in Cause-effect graphs:
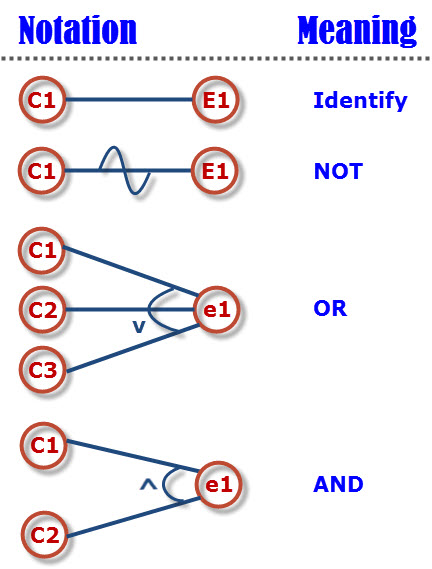
Just assume that each node having the value 0 or 1 where 0 shows the ‘absent state’ and 1 shows the ‘present state’. The identity function states when c1 = 1, e1 = 1 or we can say if c0 = 0 and e0 = 0.
The NOT function states that, if C1 = 1, e1= 0 and vice-versa. Likewise, OR function states that, if C1 or C2 or C3 = 1, e1 = 1 else e1 = 0. The AND function states that, if both C1 and C2 = 1, e1 = 1, else e1 = 0. The AND and OR functions are permitted to have any number of inputs.
Test cases can be designed for the triangle problem in the following ways
Firstly: Recognize and describe the input conditions (causes) and actions (effect).
The causes allocated by letter “C” are as follows,
C1: Side “x” is less than sum of “y” and “z”
C2: Side “y” is less than sum of “x” and “z”
C3: Side “z” is less then sum of “x” and “y”
C4: Side “x” is equal to side “y”
C5: Side “x” is equal to side “z”
C6: Side “y” is equal to side “z”
The effects designated by letter “e” are as follows,
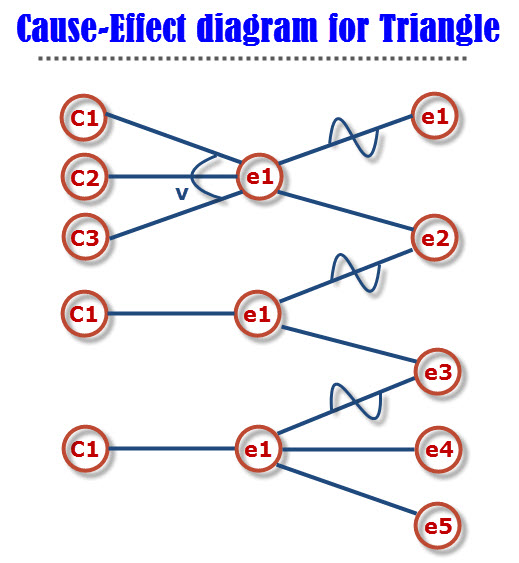
e1: Not a triangle
e2: Scalene triangle
e3: Isosceles triangle.
e4: Equilateral triangle
e5: Impossible
Secondly: Build up a cause-effect graph
Third: Convert cause-effect graph into a decision table
| Conditions | R1 | R2 | R3 | R4 | R5 | R6 | R7 | R8 | R9 | R10 | R11 |
| C1: X < Y+Z? | 0 | 1 | 1 | 1 | 1 | 1 | 1 | 1 | 1 | 1 | 1 |
| C2: X < Y+Z? | X | 0 | 1 | 1 | 1 | 1 | 1 | 1 | 1 | 1 | 1 |
| C3: X < Y+Z? | X | X | 0 | 1 | 1 | 1 | 1 | 1 | 1 | 1 | 1 |
| C3: X=Y? | X | X | X | 1 | 1 | 1 | 1 | 0 | 0 | 0 | 0 |
| C4: X=Y? | X | X | X | 1 | 1 | 0 | 0 | 1 | 1 | 0 | 0 |
| C5: X=Y? | X | X | X | 1 | 1 | 0 | 0 | 1 | 1 | 0 | 0 |
| C6: X=Y? | X | X | X | 1 | 0 | 1 | 0 | 1 | 0 | 1 | 0 |
| e1: Not a Triangle | 1 | 1 | 1 | ||||||||
| e2: Scalene | 1 | ||||||||||
| e3: IsoScele | 1 | 1 | 1 | ||||||||
| e4: Equilateral | 1 | ||||||||||
| e5: Impossible | 1 | 1 | 1 |
Fourth: 11 test cases according to the 11 rules.
| Test Case | X | Y | Z | Expected Result |
| 1 | 4 | 1 | 2 | Not a triangle |
| 2 | 1 | 4 | 2 | Not a triangle |
| 3 | 1 | 2 | 4 | Not a triangle |
| 4 | 5 | 5 | 5 | Equilateral |
| 5 | ? | ? | ? | Impossible |
| 6 | ? | ? | ? | Impossible |
| 7 | 2 | 2 | 3 | Isosceles |
| 8 | ? | ? | ? | Impossible |
| 9 | 2 | 3 | 2 | Isosceles |
| 10 | 3 | 2 | 2 | Isosceles |
| 11 | 3 | 4 | 5 | Scalene |
Over to You:
In today’s article we have seen about What is Cause and Effect Graph Testing Technique, Steps to proceed on Cause-Effect Diagram, Symbols used in Cause-effect graphs and most important is how to design the test case using Cause and Effect Graph Testing Technique. In the upcoming article I will cover the next interesting test case design technique called as State transition testing technique.
If you like this article you would also like to subscribe to our software testing email newsletter for software testing latest updates.
Happy Testing!!!
Don’t Miss Another Article
Join over 10,000 people who get FREE and fresh content from this Blog. We Respect Privacy, You’re Safe! No Spam!

6 thoughts on “What is Cause and Effect Graph Testing Technique – How to Design Test Cases With Example?”
Base on the input condition ( Cause)as not same as Cause effect diagram
Good one as always.
Unable to understand the diagram and the table.
Thanks for explanation good work..
@sonia : in table in first coloumn they have wrongly mentioned coloumn and one more thing is to understand the proble first thing u need to know is laws of triangle that one side of triangles will be always less than sum of two other sides. And one more thing is if x=y and x=z then y!=z is impossible.
Hope now u can under stand.
can someone explain the cause effect graph and decision table for rectangle
dense explanation. Please give a relevant explanation example for IT/QA